After the Storm: Why Private Credit Redemption Queues Will Endure
- Mark Goldberg

- Jun 24
- 13 min read
Updated: 2 days ago
A mathematical analysis of non-traded BDC redemption queues
Prepared by Mark Goldberg | June 25, 2026
Mark M. Goldberg, Alternative Investments Market Intelligence, 25 June 2026, “After the Storm: Why Private Credit Redemption Queues Will Endure”, https://www.altsmi.com/post/after-the-storm-why-private-credit-redemption-queues-will-endure |
Key Findings:
Redemption queues at some of the largest non-traded private credit funds will take 2 to 3+ years to clear - not the “few quarters” managers suggest.
Headline redemption numbers will keep climbing even as the panic fades because unmet redemptions resubmit and stack. The math dictates the outcome. Expect headlines to get worse even though peak stress is likely cresting.
Clearing the queue is the precondition for fundraising to restart. Managers who wait are underestimating how long queues will persist and will prolong the tepid inflows.
The Nor'easter Problem
In February 2026, a nor'easter shut down much of the East Coast for the better part of two days. More than 8,000 flights were cancelled. And then the storm passed. The runways were plowed, the airports reopened, the clouds cleared, and the sun was shining… and frustrated travelers still could not get home.
The reason was the queue. Two days of cancelled flights had created a backlog of displaced passengers that vastly exceeded the number of remaining seats on any given day. Most flights are booked in advance with over 80% utilization. People are booked to fly unrelated to the storm. Travelers looking to rebook that morning simply have to grab the few seats left then join the back of a line that was already days long. It took most of a week for the system to clear, long after the event that caused it had become a memory.
This is the most important thing to understand about the redemption pressure now building across non-traded private credit funds. The prevailing assumption, stated explicitly by many managers is that once sentiment normalizes and the headlines fade, the redemption queues will resolve. That is the “the storm has passed, so we must be fine” fallacy. The storm passing is necessary, but nowhere near sufficient. What governs how long investors wait is not when requests stop rising, but how large a backlog accumulated and how slowly the exit can clear it.
And here the analogy breaks in a way that should worry managers more, not less. A weather system cannot feed on itself; once it moves offshore, it is gone. A redemption queue can. Its very persistence is a signal that suppresses new inflows and prompts still more investors to join the line. Unlike the storm, the queue is capable of regenerating the conditions that created it. That distinction, developed below, is what turns a liquidity inconvenience into a multi-year problem.
How the Queue Actually Works
Non-traded BDCs limit redemptions to roughly 5% of net asset value per quarter. This cap is not a problem in itself — it functions exactly as designed, metering outflows so the fund is never forced to dump illiquid loans. But it also means that when quarterly requests exceed 5% of NAV, the excess does not disappear. It rolls forward and is, with documented regularity, resubmitted the following quarter, on top of whatever new requests arrive.
That rollover produces a clean, verifiable relationship, which the reported data confirms:
Headline Requests = Rolled-over Queue + New Demand
HPS Corporate Lending Fund (HLEND) reported 9.2% redemption requests in Q1. It redeemed 5%, leaving a 4.2% unmet queue. New redemption requests arrive for a variety of reasons: normal portfolio rebalancing, liquidity needs, reallocations, rising concerns about a fund — and the existence of the redemption queue itself. HLEND reported 13.3% redemption demand in Q2, which implies 9.1% of new demand (13.3% − 4.2% Q1 unmet = 9.1% new).
In this instance, HLEND has persistent new redemption demand of approximately 9% and a building unmet queue, which increased this quarter from 4.2% to 8.3%.
Apollo Debt Solutions (ADS) reported 11.0% redemption demand in Q1. It redeemed 5%, leaving a 6.0% standing unmet queue. It reported 16.8% redemption demand for Q2, which implies 10.8% of new demand (16.8% − 6.0% Q1 unmet = 10.8% new).
In this instance, ADS has mildly decelerating new redemption demand, going from 11.0% to 10.8% — but the queue is building. In Q1 it had a 6.0% unmet queue; it finished Q2 with an 11.8% unmet queue. So even if new demand drops to, say, 8%, you can expect a headline number of 19.8% next quarter.
Ares Strategic Income Fund (ASIF) reported 11.6% redemption demand in Q1 (11.0% of it was new, after a 0.6% queue carried in from Q4-2025). It redeemed 5% in Q1, leaving a 6.6% standing unmet queue. They reported 14.4% redemption demand for Q2, which implies 7.8% of new demand (14.4% − 6.6% Q1 unmet = 7.8% new).
In this instance, ASIF shows the cohort's most pronounced decline in new redemption demand, falling from 11.0% to 7.8%. But that doesn’t stop the queue from building. In Q1 it had a 6.6% unmet queue; it finished Q2 with a 9.4% unmet queue. So even as new demand eases further to, say, 5.8%, you can still expect a headline number of about 15.2% next quarter. It is the clearest case in the group of a rising headline masking a cresting signal.
The Headline Keeps Climbing Even as New Demand Crests

Note: We used a steady state estimate for redemptions of 9% for HLEND, 8% for ADS, and 5.8% for ASIF to demonstrate the mathematical impact on the queue. It is not intended to be a projection. The headline keeps climbing even as new demand plateaus or declines: the navy bars (current sentiment) hold roughly flat while the gold rolled-over queue stacks, pushing reported demand higher each quarter. The 5% cap line is all that is actually redeemed.
In all three instances the unmet queue is growing, and both are likely to show much higher redemption-request headline numbers in coming quarters. Yet the peak stress may have already passed. The headline is a lagging, inflated figure; new demand is the real-time signal, and it has already begun to roll over.
When will this nightmare end? Not soon. If you assume a fund reaches a peak unmet queue of 15% in the coming quarters and then returns to normalized redemptions of 3%, you can only work off the remaining queue in 2% increments (5% cap − 3% normal redemptions = 2% drain). In that instance it will take roughly 8 quarters after peak unmet redemptions to clear the queue. But you can only start the 8-quarter clock when unmet queue peaks and it hasn’t yet for most funds.
Methodology: Letting Each Fund Forecast Itself
As the prior section showed, the headline request rate is inflated by prior unmet requests that appear to be resubmitted in the next tender window. The reported numbers strongly support that is the condition and the behavior. The point is not that every investor resubmits every dollar. It is that the aggregate data undermines the notion that investors with unmet redemption requests simply reconsider, withdraw, and remain invested. Although this issue has been contested, the reported results now make it central to any realistic analysis of queue duration.
The unmet queue will keep climbing even after the underlying impulse has crested. The cleaner measure is new demand: the headline less the prior quarter's unmet queue. New demand strips out the rollover and isolates the fresh redemption impulse, which makes it the real-time read on sentiment.
By that measure, the fever has already broken for some funds. Across the cohort, new demand crested in Q1 2026 and edged lower in Q2 - Ares’ new demand fell from roughly 11% to 7.8%, Apollo from 11.0% to 10.8%, HPS from 9.2% to 9.1%. Blackstone is the exception: having cleared its Q1 queue by redeeming above the cap, its Q2 new demand actually rose, to roughly 9.3% of NAV. But the queue does not break with it. New demand remains well above the 5% cap, so every quarter still adds to the backlog. The queue keeps growing until new demand falls back below the cap. That crossing is both the headline's peak and the queue's high-water mark and only then does the backlog begin to drain.
Three quantities define the timeline:
Normal redemption rate. the ordinary, non-stressed level of new demand from routine rebalancing — roughly 2.4% of NAV per quarter for funds in years three to four, and ~3.25% for large, mature funds. This metric was the subject of a prior research note.
Excess capacity. the 5% cap minus the normal rate - the rate at which the backlog drains once new demand returns to normal. 1.75% for mature funds, 2.6% for mid-stage funds.
Peak queue (high-water mark). the size of the backlog at the moment new demand falls back below the cap - the figure the excess capacity must then work off, one slow quarter at a time.
The pace therefore hinges on how quickly new demand completes its normalization. A slow glide back to normal does double damage: it raises the high-water mark and lengthens the drain. This is why, across every stressed fund, the clearing is measured in years.
The Shape of the Decline: A Right Tail, Not a Snap-Back
The decisive feature is what happens after new demand crests. The headline does not fall as fast as it rose. Because the unmet queue resubmits every quarter, the reported figure recedes only as fast as the fund physically drains it. The result is not a bell curve but a shark fin: a steep, sentiment-driven rise followed by a long, slow declining tail whose downslope is set by the cap, not by sentiment.
This asymmetry is the heart of the matter. A symmetric decline would clear the queues in under a year. It is precisely because the exit processes only a fixed sliver of NAV each quarter, while the line keeps resubmitting, that clearance stretches into years. The nor'easter, exactly: the line does not clear at the speed the storm departs; it clears at the rate of open seats.

The plotted line is the headline request rate. Its rise and roll-over are observed; the long tail is the structural consequence of the queue resubmitting itself each quarter, draining only at the excess-capacity rate even after new demand has normalized. The queue clears only when the line crosses back below the 5% cap
What the Data Shows
The picture across the cohort is unambiguous.

Headline peak = the quarter new demand falls back below the 5% cap; it equals the queue's high-water mark plus the cap.
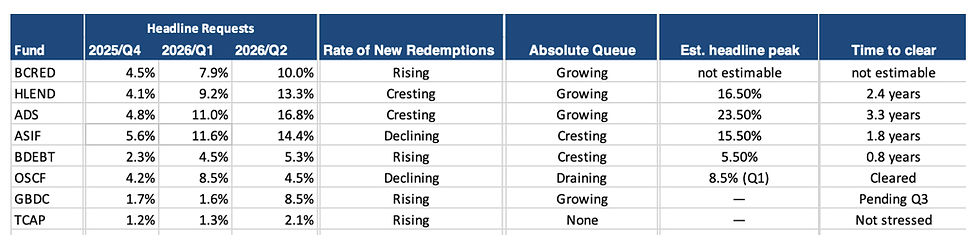
Of the funds that have reported, HPS, and ADS are in multi-year backlogs, clearing in 2.4 to 3.3 years with each figure driven by the pace at which the fund's new demand normalizes back below the cap, the point at which its queue stops growing. Blackstone’s (BCRED) queue is still forming. Its new demand rose in Q2 rather than cresting, so its clearance date cannot yet be fixed, though its narrow drain assures it will be measured in years once it peaks. None clears in “a few quarters,” and no reasonable reading of the data suggests otherwise. Oaktree sits in a different category entirely: it never approached critical mass. Facing a single quarter only modestly above the cap, it chose to exceed the cap and redeem the small backlog outright, and requests fell back below 5% the next quarter. It is not evidence of the slow grind. It is the example of avoiding one. Golub entered stress only in Q2 and will resolve to a timeline once it decelerates; Twin Brook never breached the cap. Ares (ASIF), is the clearest live example of the dynamic: its Q2 headline rose to 14.4%, yet stripping out the resubmitted queue, new demand fell from roughly 11% to 7.8%, the crest beneath the rising headline number. As further funds report I will update these charts.
Why the Biggest Fund Is Not the Fastest to Clear
Blackstone’s (BCRED) fund carries only a ~5% standing queue, which invites the assumption that it clears in a quarter or two. It does not. Its queue is also newly formed. In Q1, BCRED went above the ordinary 5% framework and substantially cleared the quarter’s requests. Q2 demand then rose to approximately 10%, the fund returned to the 5% cap, and a fresh queue formed. New demand has not yet turned down, and because it sits well above the cap, the queue is still growing, and the headline is still rising. The static “drain today's queue” math is overtaken on both sides: the backlog is still building even as sentiment cools, and what exists drains through the narrowest door in the cohort. As a large mature fund, Blackstone's normal redemption rate (3.25%) consumes most of the 5% cap, leaving only 1.75% per quarter to work off the backlog. The constraint is not the size of the queue; it is the width of the door.
The Queue Feeds Itself
A standing queue is not a passive backlog waiting to be processed. It is an active signal and the signal is corrosive. Its persistence does three things at once. It suppresses new inflows, because fewer advisors allocate fresh capital into a fund whose existing investors are visibly lined up to leave. It invites additional redemptions, as investors who might otherwise have stayed conclude they would rather not be last in line. And each of those reactions lengthens the very queue that produced them. The backlog, in other words, is partly its own cause.
The cap can quietly perpetuate this loop. By metering outflows to a fixed sliver each quarter, it keeps the queue visibly present quarter after quarter, in every shareholder report. It also keeps the signal alive. A queue allowed to grind down slowly under the cap does not merely take years to clear; it broadcasts distress the entire time, draining replacement capital and seeding fresh redemptions throughout. The slow path is not just slow. It is self-perpetuating.
This reframes the economics of going over the cap. The cost redeeming beyond 5%, by drawing on the balance sheet is one-time and finite. The benefit is breaking the feedback loop. That can be a large and compounding benefit: a cleared queue removes the signal, which simultaneously halts the incremental redemptions it was generating and restores the conditions for inflows to return. Measured against a backlog that would otherwise reinforce itself for years, decisive clearing is not an expense. It is one of the highest-return uses of balance sheet a manager has.
Why, then, have so few done it? Two reasons: First, some of the queues are just too big to resolve without damaging the fund. The second is more nuanced: because the decision looks entirely different if you believe the queue will clear on its own in two or three quarters. Under that assumption, going over the cap is an unnecessary cost. Why spend balance sheet to accelerate something that will resolve itself shortly? The error is upstream: a dramatic underestimate of how long a queue actually persists under the cap, and of how severely that persistence starves the fund of replacement capital. Correct those two assumptions, as the data now forces us to, and the calculus inverts.
Closing the Queue: The Last Mile
It follows that there is a decisive move available to managers on the back side of the curve. Once a fund's request rate is clearly in decline and falls below roughly 7% of NAV or a standing queue under 2%, the disciplined course is to exceed the cap briefly and extinguish the remainder outright. The residual backlog at that point is small enough to absorb without forcing asset sales, and the payoff is asymmetric: a fully cleared queue removes the overhang that suppresses sentiment, signals balance-sheet strength, and is, in practice, the precondition for fundraising to resume its growth. A queue left to grind down slowly under the cap keeps both the overhang and the fundraising drought in place far longer than necessary. Clearing it decisively is how a fund turns the page. Blackrock’s (BDEBT) should look carefully at the actions Oaktree (OSCF) took if Q3 new redemptions decelerate or crest. Oaktree confronted with a single quarter above the cap, it leaned in, redeemed beyond the 5% limit, and extinguished the queue before it could compound and returned to normal the following quarter.
I’m Invested
This is a mathematical and behavioral analysis of liquidity timing. It is not a statement about portfolio values, credit quality, or manager investment performance. I am personally invested in private credit with a manager listed here. I expect the fund to perform well. The caps are operating as intended; no investor is at risk of loss by virtue of the queue alone. The purpose of this research is narrower and firmer: the wait to exit will be measured in years, not quarters. Managing to that reality, rather than against it, is what protects both performance and reputation.
Recommended Actions
The analysis points to a short list of concrete steps for managers and advisors alike.
1. Stop promising resolution in two or three quarters. This applies equally to investment managers and to advisors. The math does not support a near-term clearing, and the gap between that promise and the multi-year reality will damage credibility precisely when it matters most. An expectation set today at “quarters” becomes a broken promise tomorrow. Reset it now, to years, and be the source clients trust for having told them the truth early.
2. Manage the balance sheet to realistic shrinkage. (Investment Managers) Plan for the fund to be smaller. Size liquidity and structure the portfolio so the fund is never forced to liquidate positions into a weak market at an inopportune time. Orderly, anticipated shrinkage preserves NAV; forced selling to meet a queue destroys it. Build the runway now, while the decline is still ahead of you including the capacity to clear the last mile decisively once the queue turns down.
3. Double down on valuation rigor and portfolio disclosure. (Investment Managers) Much of the redemption pressure traces to the gap between model-based NAVs and where assets would clear in the market. Tighter valuation methodology and fuller, more frequent disclosure of portfolio metrics are the most direct levers for rebuilding the confidence that slows redemptions and, ultimately, restarts inflows. Transparency is not a defensive posture here; it is the fastest route back to growth.
When the next quarter's headlines show ever increasing redemption totals and they will, know that the rate of increase is already cresting and in decline. That is the good news. The bad news is the headline will belie this fact. Please stop saying this will be over in a few quarters. It will not be over. Like the travelers stranded in clear skies after the February storm, investors in these funds are in a line whose length was set by the storm but whose clearing is governed by the width of the exit. Plan for the queue, not the weather.
Methodology note: Public non-traded BDCs only. Headline request rates Q4 2025–Q2 2026 as reported; NAV as of 3/31/2026. New demand = headline request less the prior quarter's unmet queue. Headline peaks estimated by projecting each fund's decelerating quarter-over-quarter new-demand growth back below the 5% cap, then declining along the excess-capacity rate. Funds with only two reported quarters (Blue Owl OCIC and OTIC) are excluded pending Q2 data. Ares (ASIF) reported after the initial cut — 14.4% headline requests redeemed at the 5% cap, implying new demand down from ~11% to ~7.8% — and is incorporated; OTIC's reported Q1 queue of 35.6% of NAV already implies a multi-year case.
Mark Goldberg is the founder of Alternative Investments Market Intelligence (AltsMI). This analysis is prepared for financial professionals and institutional audiences. It does not constitute investment advice. The author has had in the past and may have at time of publication a position in the companies and/or funds mentioned in his research.
Mark M. Goldberg, Alternative Investments Market Intelligence, 25 June 2026, “After the Storm: Why Private Credit Redemption Queues Will Endure”, https://www.altsmi.com/post/after-the-storm-why-private-credit-redemption-queues-will-endure |