2024 RESEARCH NOTE #1 Adoption: Who’s Using Alts and How Much?
- Mark Goldberg

- May 20, 2025
- 5 min read
Updated: Mar 10
Alts Leaders Survey 2024 | Research Note 1
Executive Summary
The landscape of alternative investments continues to evolve rapidly. This research note explores the accelerating adoption of alternatives and larger allocations in portfolios across key distribution channels, including Banks, RIAs, and Independent Broker-Dealers.
Driven by market dynamics, regulatory innovations, and enhanced access through innovative structures, alternatives are no longer a niche strategy reserved for institutional investors. Instead, it has become a core component of portfolio construction for a growing share of affluent investors. This report outlines adoption trends, projects future growth in client usage in portfolio allocation, and examines the key factors influencing this transformation.
With a projected compound annual growth rate of over 10% in client adoption and 11% in wallet share, alternatives are poised to play an even more prominent role in delivering diversified returns and enhanced outcomes for private wealth clients.
Key Insights
Adoption rates of alternative investments continue to rise across all distribution channels, with current usage ranging from a low of 11.9% among Independent Broker-Dealers to a high of 20% among Banks. This disparity likely reflects differences in client wealth across these segments.

Notably, adoption is forecasted to grow across the board, with the most significant projected increase among National RIA firms. Their anticipated 48% growth in adoption by 2026 aligns with the rising popularity of Interval Funds, the preferred structure for RIAs. As publicly registered entities governed by the Securities Act of 1940, Interval Funds offer familiar investor protections, ease of access, and mandatory provisions for periodic liquidity (cannot gate), making them an attractive gateway to alternative strategies for RIAs.
Banks and Regional Broker-Dealers maintain higher-than-average adoption rates, driven by top-down firm support to enhance client outcomes. These firms often provide proprietary research and specialist teams, a key factor in accelerating adoption. Firm research and support are provided by some National RIA firms as well. Conversely, independent RIAs can choose investment funds without the support of national firm research and gatekeeper approvals. They proved to be early adopters, but without the benefits of top-down research and specialist support, we project that they will have slower growth rates.
The overall compound annual growth rate (CAGR) for client adoption of alternatives is forecasted at 10.6%.
Wallet Share Growth:
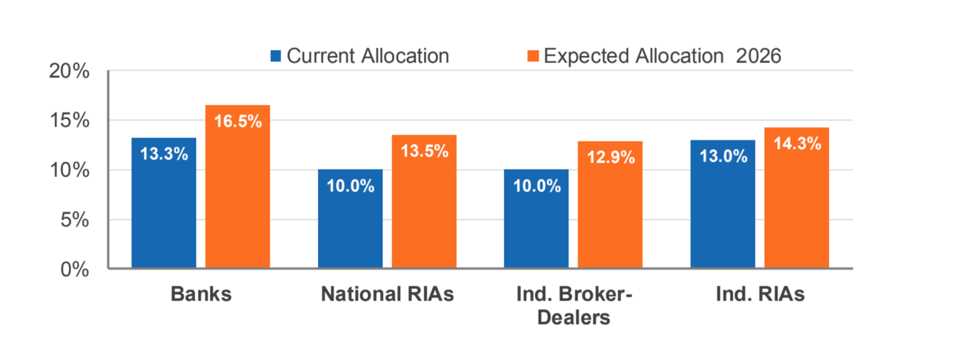
Initial allocations to alternatives are typically modest but grow over time as clients and advisors become more comfortable with these strategies. For example, Banks and Regional Firms have seen average allocations rise from 4.2% in 2022 to 13.3% today, with expectations reaching 16.5% by 2026.
This growth is fueled by several factors beyond just initial adoption. Once tried, alternative investments often see expanded use based on positive experiences. This evidences that clients and the financial intermediaries who serve them are pleased with their experiences.
Interestingly, there is minimal differential between allocation percentages and growth rates amongst firm types. You see similar outcomes once you eliminate the attribute of client wealth differential between firms (for all those with sufficient wealth to invest) and ask for their allocation to these strategies.
The expected wallet share CAGR is 11.1%, driven by the following key factors identified in executive interviews:
1. Investment Performance: NAV REITs calculate and disclose monthly net asset values (“NAVs”). This process affords investors seeking liquidity or those acquiring new shares to transact with current pricing. The frequency of these valuations has allowed industry analysts to benchmark performance. RAStanger & Co., a real estate investment banking and financial advisory firm, uses monthly reporting to create a NAV REIT Index. Since the inception of the Stanger NAV REIT Index, NAV REITs have outperformed all the traded REIT indices by almost 20% over the 10 years.

2. Entry of Institutional Managers: The recent entry (last 6 years) of Blackstone, Apollo, KKR, Ares, Brookfield, and PIMCO, to name a few managers who have proliferated offerings of Alternative Investments into the private wealth market, has been notable. It expanded the general public’s exposure to the benefits of alternative strategies and made the investment strategies that were previously available to institutions more accessible. Their participation has encouraged banks and regional firms to embed alternatives more deeply into client portfolios.
3. Proliferation of Nuanced Strategies: The number of offerings structures include perpetual, finite life, public, private, private draw-down, private with public reporting married with redemption (investor liquidity) privileges that include tender offers, periodic interval liquidity, and no redemption options. Asset Class exposure incorporates numerous broadly diversified offerings, feeder funds, co-investment (with Institutional Funds), Secondaries, and over 16 sector specific funds deploying enumerable strategies targeting current income, growth, and total return. An investor seeking exposure to virtually any private market strategy has choices today that were unavailable 10 years ago below a minimum investment of $5 million. Access to private market opportunities for the mass affluent has accelerated rapidly.
4. Periodic Liquidity largely met: Most of these funds offer some measure of liquidity, typically 5% of the overall fund per quarter. The benefit of capturing mispricing and the liquidity discount of private markets for investors was thought to belie the ability of funds to meet investors' liquidity needs when liquidity demand would rise. Various methodologies, including cash, liquid securities, and leverage, are used to meet short-term liquidity needs before assets are sold. However, the initial uneasiness of gatekeepers to approve products in their respective firms was partly due to this appropriate concern.
The downturn in commercial real estate values began in early to mid-2020, triggered by the Covid-19 pandemic. Outlook and sentiment differed by RE segment. However, new investment allocations to the sector slowed by the year-end of 2020, and redemptions in NAV REITS began in earnest by the year-end of 2021. Over the next 40-month period, $43.3billion (or 41%) of the $107 billion outstanding AUM at the start of 2022 were redeemed. Kevin Gannon, Chairman of RA Stanger, and a leading authority of the industry noted “the ability of the funds to meet this level of liquidity demand confirmed the efficacy and permanence of semi-liquid structures in the marketplace.

5. Processing and Reporting Improvements: Numerous technology and processing improvements have made investing and delivering performance reporting in digital format less cumbersome. iCapital has revolutionized the subscription process and client management. Today, they offer bespoke solutions for dealers and their portal for Investment Managers seeking access to the RIA market. Firms like CAIS have followed with their technology solutions and support for sales distribution. Solutions for PPM delivery and compliance, such as Subscribe, have proliferated. SS&C and other transfer agents have committed significant resources to support both investment managers and broker dealers in delivering timely valuation reporting data for client statements and tax reporting. The operational needs of both managers and financial intermediaries are evolving. With the continued improvement in operational support, adoption and allocation (wallet share) rate will continue to grow.
This steady adoption underscores that alternatives are no longer a niche allocation, they're increasingly mainstream across client portfolios. You often hear firms speak to 50/30/20 allocation between Stocks/Bonds/Alternatives versus the 60/40 Stock/Bond allocation.
This phenomenon has produced a widening gap between State Securities Administrators who seek to limit wallet share by proposing and imposing limits on publicly registered (SEC reviewed) offerings at 10% or less per client. This restriction is viewed mainly outside of the confines of the North American State Administrators Association (NASAA) as a regressive approach. The characterization of “regressive” is because this state policy has led many offerings to be privately registered and not subject to SEC review and State review and restrictions. It is difficult to argue this is a benefit to investors and not a perverse outcome. For further insight, see opinion pieces on this topic on this website.
The combination of growth in adoption rate and wallet share has a geometric impact on growth in capital flows.